Output Tab
The audio output tab (called “Outputs” in the title bar) provides a list of all rendered IRs, as well as different analysis information of the audio files and a means to save them.
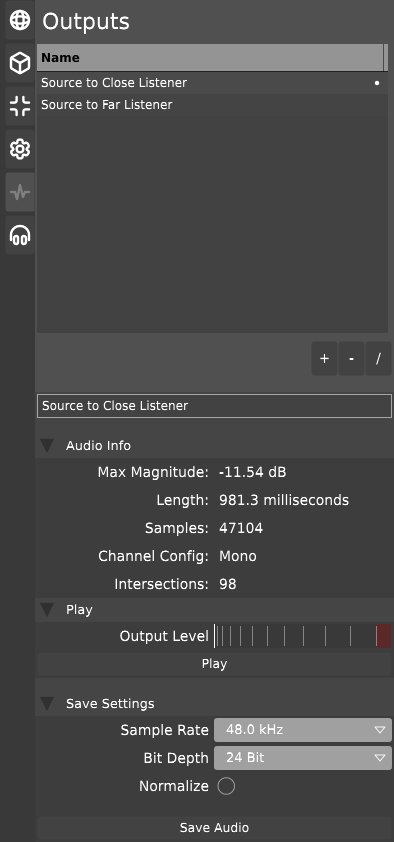
The listbox displays the various IRs that have been rendered and are stored in the application. The naming scheme for the outputs is “[Source Name] to [Listener Name]”. If an IR has been rendered but it’s determined that there has been some kind of error during processing, the list box item will be highlighted as red, and an error icon will display.
When one of the items is selected, a subsection called “Audio Info” will show up. This provides information such as the maximum magnitude, the time & sample length, the channel configuration, and the number of ray segments that intersect with the given position.
Underneath the Audio Info section, a “Play” section allows the user to preview the impulse response through whatever audio device is set up.
There are also sections for doing saving and “batch saving”. The save actions provide the option of specifying a sample rate which can differ from the one that was specified in the render settings (Impulse will resample the audio to match the new sample rate), as well as the sample bit depth and normalisation toggle.
Batch saving allows for all rendered audio files to be saved to a specific location. This feature is only shown when The “Normalisation Method” adjusts how the saved audio files will be normalised:
- “None” performs no normalisation
- “Absolute Peak” normalises the audio files so that the absolute highest peak of all of the audio files will be 0dB
- “Individual” normalises the audio files so that each audio file will have it’s own individual highest peak at 0dB
Analysis Views
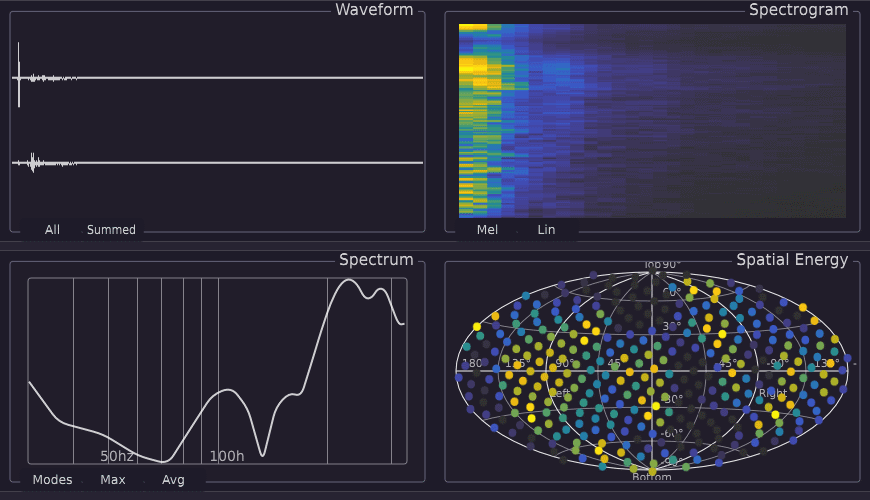 Each audio file also has a variety of analysis algorithms applied to it, which are visible in the lower section of the interface when the Output Tab is active;
- Waveform: The waveform view displays the audio file’s magnitude over time.
Each audio file also has a variety of analysis algorithms applied to it, which are visible in the lower section of the interface when the Output Tab is active;
- Waveform: The waveform view displays the audio file’s magnitude over time.
- Spectrogram: The spectrogram view displays the audio file’s magnitude over the frequency spectrum over time. You can switch between displaying a "mel" spectrogram (processed to more finely display lower frequencies), and a linear spectrogram (unprocessed).
- Spectrum: The spectrum view displays different audio spectrum information. The “Modes” view displays how low frequencies of audio will resonate against the acoustic space at the given listener position, and the “Max” and “Avg” buttons display the maximum and averaged spectral values (essentially a one-segment representation of the previous Spectrogram view)
- Spatial Energy: The spatial energy view displays the audio energy based on its incoming direction to the listener position. This view is only available when outside of the mono view, and its resolution depends on the quality of the spatial processing used; stereo IRs will provide a very simple spatial energy view, while high-order ambisonic views will provide very complex spatial energy analysis.